

Last Updated: September 16, 2026
Learning how to read HPLC reports for peptides starts with one fact: the report is a purity fingerprint, not a certificate of identity. High-performance liquid chromatography separates the components of a peptide sample and quantifies how much of it is the target molecule versus everything else. (Source: FDA’s guidance on analytical procedures and method validation)
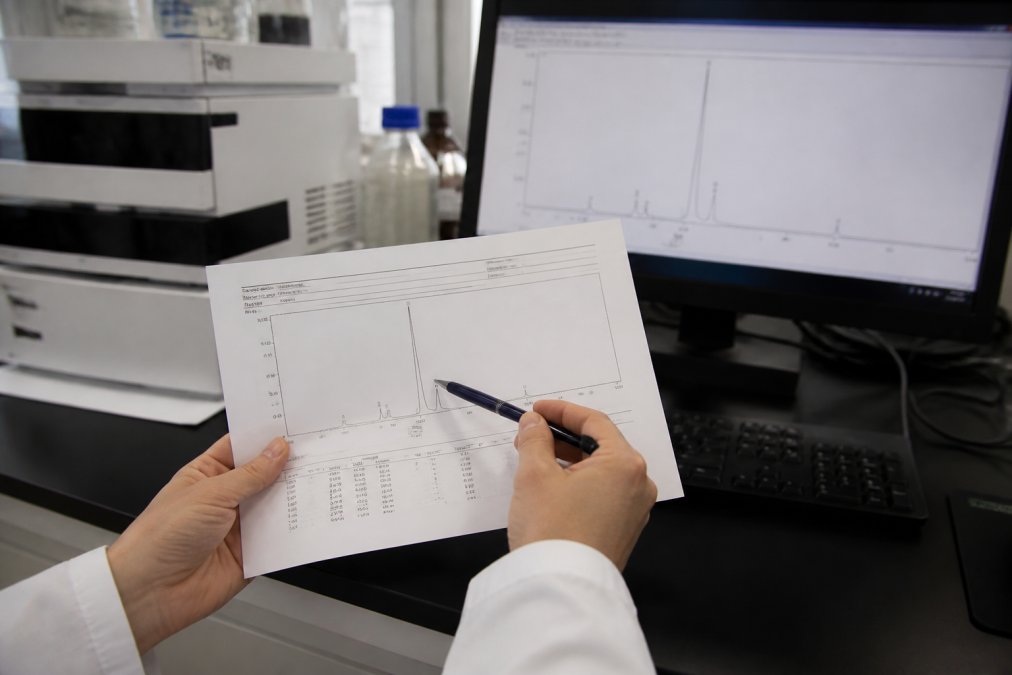
A chromatogram shows retention time, peak area, peak shape, and baseline behavior. Together, these reveal whether your peptide is pure, degraded, or misidentified. The sections below walk through each element, show you how to spot red flags, and explain how to verify the third-party lab reports that back a Certificate of Analysis.
The chromatogram is a graph of detector signal against time. Each peak represents a compound eluting from the column, and its position and size carry the diagnostic information.
Retention time is the time between injection and when a compound exits the column. Under a fixed analytical method, a peptide’s retention time is reproducible, so a shift signals a problem with the method, the column, or the sample itself. Peak area is proportional to the amount of that compound present. Purity percentage is the main peak’s area divided by the total area of all peaks, expressed as area percent.
Purity by area percent is the main peak area divided by the sum of all peak areas, multiplied by 100. If the target peak integrates to 9,850 units and all peaks total 10,000 units, purity is 98.5% by area.
Two caveats matter here. Area percent assumes every compound absorbs similarly at the detection wavelength, which is not always true. And it only counts what the method detects.
| What you see | Likely cause | What it means for you |
|---|---|---|
| Small peak just before main peak | Deletion sequence or oxidized variant | Normal at low levels; question if >2% |
| Cluster of late-eluting peaks | Aggregation or incomplete deprotection | Suggests poor purification; request re-test |
| Shoulder on main peak | Co-eluting diastereomer | Purity number may be overstated |
| Rising or drifting baseline | Column bleed, mobile phase issue, or detector drift | Integration unreliable; purity figure suspect |
| Jagged, high-frequency baseline | Electrical noise or low signal | Small peaks cannot be integrated accurately |
| Peak tailing to the right | Secondary interactions with stationary phase | May mask a co-eluting impurity |
| Ghost peaks appearing in blank runs | Carryover from prior injection or contaminated mobile phase | Not your peptide; method problem |
| Negative dip before main peak | Refractive index mismatch from injection solvent | Usually harmless, but check method notes |
Here is the practical split:
| Method | What It Confirms | What It Misses |
|---|---|---|
| Reversed-phase HPLC | Purity percentage, impurity profile | Molecular identity |
| LC-MS | Molecular weight, structural integrity | Precise quantitation |
| Amino acid analysis | Composition and peptide content | Sequence order |
Ask for the mass spectrum alongside the chromatogram. The observed mass should match the calculated molecular weight of your peptide within a tight tolerance. A mismatch of even a few units is a red flag worth raising before you use the material.
The standard checklist. Every CoA should carry these elements:
The FDA guidance on current good manufacturing practice sets the framework that reputable manufacturers and compounding facilities follow, which is why batch traceability matters. If the lot number on the CoA does not match your vial, the document tells you nothing about your material. Independent testing is the backbone of that verification, and it is why every product we carry undergoes third-party analysis before it ships.
Watch for these patterns:
If any of these are missing, ask the supplier directly. A legitimate operation will send the full documentation.
Look at the main peak’s area percentage on the chromatogram. A 99% purity result means the target peptide accounts for 99% of the total peak area detected. Check that the baseline is flat, the main peak is symmetrical, and no large shoulders or extra peaks appear nearby. A high percentage with a messy baseline or heavy peak tailing is a warning sign that the real purity may be lower than stated.
The percentage is the area of the main peptide peak divided by the total area of all peaks, multiplied by 100. It measures relative purity by UV absorbance at a set wavelength, usually 214 nm for peptides. It does not measure mass or confirm molecular identity. That is why a Certificate of Analysis pairs HPLC purity with mass spectrometry data to verify the peptide’s molecular weight and structural integrity.
Impurities appear as smaller peaks before, after, or beside the main peak. Common ones include deletion sequences, truncated fragments, and oxidation products. Early-eluting peaks often signal incomplete synthesis, while late peaks can indicate aggregation or modified residues. Compare retention time against a reference standard. If the impurity profile shows multiple peaks above 1% area, the batch purity claim deserves closer scrutiny.
A Certificate of Analysis ties a specific batch number to its HPLC chromatogram, mass spectrometry result, and testing date. It lets you verify that the peptide you received matches the purity and identity claimed. Without a batch-specific CoA, you cannot confirm reproducibility across orders. Reputable suppliers like Rejuvenation Wellness Solutions provide independent lab testing with a CoA for every product, which supports consistent experimental results.