
Last Updated: August 31, 2026
The 99% peptide purity standard emerged from practical experience: anything below this threshold introduces uncontrolled variables that compromise experimental reproducibility. That remaining 1% consists of synthesis byproducts, degradation fragments, and residual solvents, contaminants that can trigger unexpected biological responses or skew data interpretation.
Why exactly 99%? High-Performance Liquid Chromatography (HPLC), the gold standard for peptide purity assessment, reliably detects and quantifies impurities down to approximately 1% of the total sample. Below that threshold, detection becomes probabilistic rather than definitive. Setting the standard at 99% aligns with what analytical chemistry can actually measure with confidence.
Different research applications have different purity demands. Preliminary screening studies might tolerate 95-97% purity, but regulatory submissions, clinical trials, and peer-reviewed publications require 99% as the minimum. Institutional review boards and journal editors treat anything lower as inadequately characterized material.
Accepting a supplier’s claim of 99% purity without verification compromises experiments. Start by requesting a Certificate of Analysis (COA) from your supplier before purchase. A legitimate COA is a technical document generated by an independent analytical laboratory, specifying the exact purity percentage, analytical method (typically HPLC), testing date, and batch number.
Many suppliers provide only summary statements without supporting data, a red flag. A proper COA includes a chromatogram, a visual representation showing each chemical component and the area under each peak. The peptide of interest should represent 99% or more of the total area under all peaks combined.
Examine the COA’s testing methodology. HPLC with UV detection is standard because it separates peptides by chemical properties and quantifies each component based on light absorption. The report should specify the wavelength used (typically 214 nm or 280 nm for peptides) and the column type. Reversed-phase HPLC is most common for research-grade peptides.
For high-stakes research, consider requesting a split sample for independent verification. Rejuvenation Wellness Solutions LLC partners with WHO/GMP and ISO-certified manufacturers who support this practice. Check the COA’s date, peptides degrade over time. For critical work, request a fresh analysis if storage conditions were suboptimal or if the peptide has been in use for an extended period.
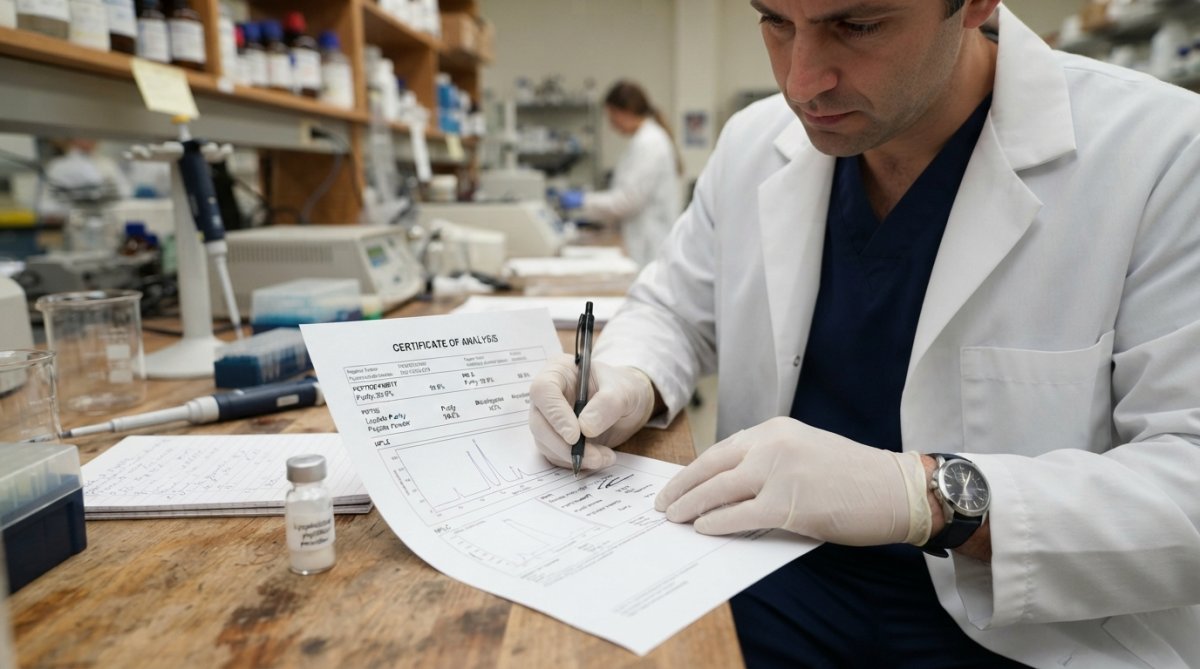
The header identifies the batch number, peptide sequence or name, supplier information, and testing laboratory. The batch number is critical, it links your specific vial to this specific analysis.
The purity section is the document’s centerpiece, reporting the purity percentage as determined by HPLC. Look for the specific wavelength (214 nm is most common for peptides), column type, and solvent system. These technical details confirm appropriate methods for peptide characterization.
The chromatogram is the visual proof. This graph plots time on the x-axis and light absorption on the y-axis. Each peak represents a chemical component. The largest peak should be your target peptide; smaller peaks are impurities. The purity percentage is calculated as (area of target peptide peak / total area of all peaks) × 100. A clean chromatogram shows one dominant peak with minimal baseline noise and small, isolated impurity peaks.
The molecular weight section confirms the detected compound matches the expected mass, typically reported as a range (e.g., 1234.5 ± 0.1 Da). The water content section reports residual moisture, peptides are hygroscopic and absorb water. A COA might report “5.2% water content,” affecting the actual molar concentration of your peptide solution.
The residual solvent section lists solvents remaining from synthesis or purification. Trifluoroacetic acid (TFA) is commonly used and often remains in trace amounts (typically 0.1-0.5% w/w for research-grade peptides). High residual solvent content can affect peptide solubility and stability.
Storage conditions are sometimes listed at the bottom, specifying recommended temperature (typically 2-8°C), humidity range, and container type. These are not suggestions, they’re the conditions under which the reported purity is valid.
HPLC (High-Performance Liquid Chromatography) is the workhorse of peptide analysis. It separates peptide molecules based on hydrophobicity as they pass through a column. A UV detector measures light absorption, creating a chromatogram. HPLC is fast (10-30 minutes), relatively inexpensive, reproducible, and well-established for regulatory submissions and quality control.
The limitation is that it measures quantity but not always identity with absolute certainty. Two different peptides with similar hydrophobicity might co-elute, appearing as a single peak.
Mass spectrometry (MS) measures the exact molecular weight of each component. A peptide with a target mass of 1234.5 Da shows a distinct peak at exactly that mass, while impurities with different masses appear at different positions. Coupling MS to HPLC (HPLC-MS) combines separation with precise mass identification, offering the highest confidence in purity assessment.
The drawback is cost and complexity. HPLC-MS instruments are significantly more expensive, and analysis requires specialized expertise and takes longer.
For most research applications, HPLC with UV detection is sufficient. Request HPLC-MS or additional mass spectrometry data when your peptide is novel or complex, you’re preparing for regulatory submission, you need to definitively rule out structural isomers, or the HPLC chromatogram shows ambiguous results.
The 1% of impurities in a 99% pure peptide is not inert background noise. Synthesis byproducts are the most common impurities, truncated peptides, branched variants, and modified versions where amino acids have undergone unexpected chemical reactions. These often have similar but not identical biological activity compared to the target peptide.
In a cell-based assay, a truncated peptide might be completely inactive or 10% as active as the full-length version. Either way, your measured response is diluted by the inactive or hypoactive component. If your impurities are partially active (say, 20% as potent as the target), your measured response is skewed upward, you’ll think your peptide is more potent than it actually is.
Degradation products form during storage or handling. Peptides are vulnerable to oxidation (especially at methionine residues), hydrolysis, and racemization. These degradation products have different structures and often different biological activity.
Residual solvents, particularly trifluoroacetic acid (TFA), can affect results if present in high concentration. Most COAs report TFA at 0.1-0.5%, which is generally acceptable. If a supplier reports 2-3% TFA, that’s excessive and suggests inadequate purification.
For high-stakes research, run positive and negative controls using the same peptide batch to account for batch-specific impurity effects.
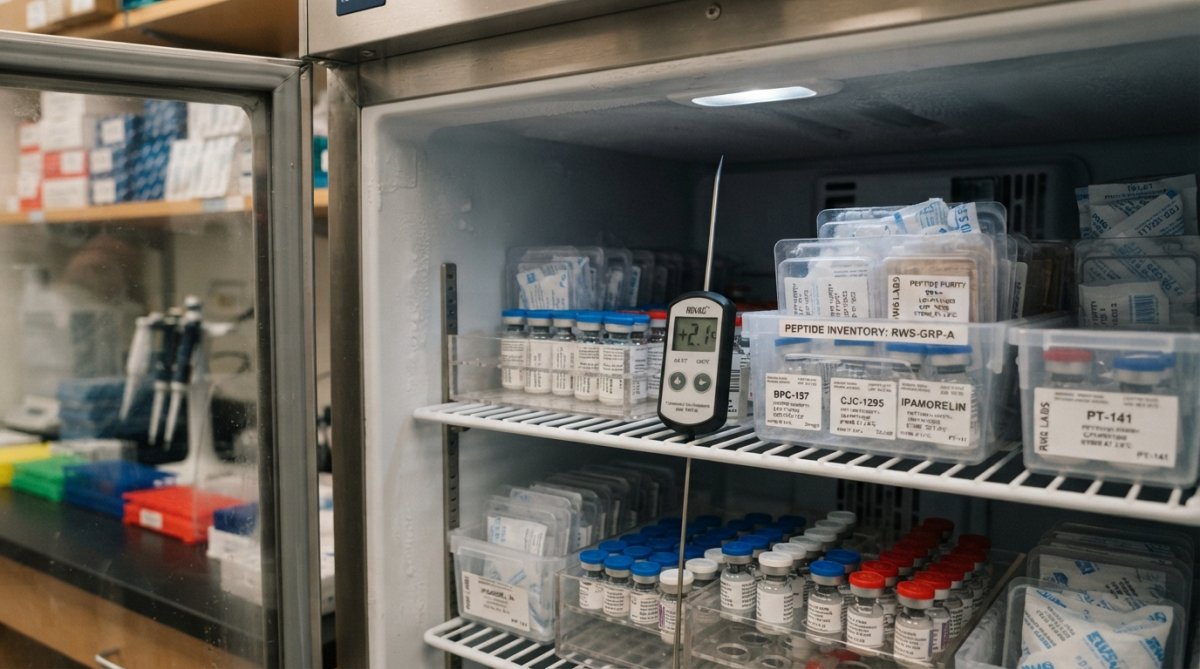
Temperature is the primary driver of peptide degradation. Most peptides are stored at 2-8°C to slow chemical reactions. At room temperature, degradation accelerates roughly twofold for every 10°C increase.
Freeze-thaw cycles are particularly damaging. Each thaw creates localized high-concentration zones that promote chemical reactions. Repeated cycles can reduce purity by 5-10% over months. Best practice: divide your peptide stock into small aliquots and keep only one thawed at a time.
Moisture and oxygen accelerate degradation. Peptides should be stored in airtight, sealed containers. Light exposure, especially UV light, degrades aromatic amino acids. Store peptides in opaque or amber-colored vials, away from direct sunlight.
A well-stored peptide at 2-8°C in a sealed, inert-gas-filled vial might remain 99% pure for 1-2 years. The same peptide stored at room temperature in a loosely capped vial might drop to 95% purity within 3-6 months.
When you receive a peptide, verify immediately that it arrived in proper condition. Check for frost on the exterior, verify the seal is intact, and confirm the batch number matches your order. Before using a stored peptide, consider requesting a fresh purity analysis if it’s been stored for more than 6 months or if storage conditions were uncertain.
The 99% peptide purity standard applies to each individual batch, but it doesn’t guarantee that every batch from the same supplier will be identical. Peptide synthesis is complex, and even with standardized protocols, subtle variations occur. Different synthesis runs might use reagents from different manufacturers, different reaction vessels, or slightly different reaction times.
For example, Batch A might be 99.2% target peptide with 0.6% truncated variant and 0.2% oxidized variant. Batch B might be 99.1% target peptide with 0.3% truncated variant and 0.6% oxidized variant. Both are 99% pure, but the impurity composition differs. If your assay is particularly sensitive to one type of impurity, this difference matters.
Batch-to-batch variability becomes critical in multi-site studies or long-term experiments. If Site A uses Batch 1 and Site B uses Batch 2, and results differ, you can’t immediately attribute the difference to site-specific factors, it might be batch variability.
Best practice for multi-batch studies: request COAs for each batch before beginning and compare impurity profiles. If profiles differ significantly, either use a single batch across all sites or explicitly document batch-specific differences in your study protocol.
For long-term studies, order all material from a single batch if possible. If you must switch batches, test a few key samples with both batches side-by-side to detect any performance differences.
The 99% peptide purity standard represents the practical threshold where analytical chemistry can reliably measure impurities, where impurity effects remain manageable and reproducible, and where regulatory and academic institutions expect research-grade material to perform consistently.
Verifying that your peptides meet this standard requires requesting and understanding Certificates of Analysis, recognizing the limits of different analytical methods, and understanding how storage and handling affect purity over time.
When you work with Rejuvenation Wellness Solutions LLC, every peptide undergoes independent lab testing with a Certificate of Analysis confirming 99%+ purity. We partner with WHO/GMP and ISO-certified manufacturers and 503B compounding pharmacies to ensure consistency, and we support both individual researchers and institutional teams with same-day order fulfillment and UPS 2-day air shipping.
FDA guidance on analytical procedures for pharmaceutical ingredients
United States Pharmacopeia (USP) standards for peptide characterization
Yes. 99% peptide purity is the established standard for research-grade peptides across academic institutions and clinical trials. At this purity level, the remaining 1% consists of minor by-products and degradation residues that typically do not interfere with experimental outcomes. Lower purity levels (95-98%) introduce more contaminants and impurities that can compromise result validity. The 99% threshold balances analytical precision with practical manufacturing and cost considerations, making it the benchmark most researchers expect when ordering peptides for scientific work.
Request the Certificate of Analysis (COA) from your supplier before purchase. The COA should include HPLC chromatography results showing the purity percentage, peak identification, and UV-detected area measurements. Verify the testing was performed by an independent third-party laboratory, not the manufacturer. Check that the document includes the batch number, testing date, and molecular weight confirmation. Reputable suppliers like Rejuvenation Wellness Solutions LLC, which partners with WHO/GMP and ISO-certified manufacturers, provide COAs as standard documentation. Never accept verbal assurances or marketing claims without supporting lab data.
HPLC (High-Performance Liquid Chromatography) separates peptide components and measures purity percentage by detecting UV-absorbed peaks. It’s the primary method for purity quantification and is cost-effective for routine quality control. Mass spectrometry provides molecular weight confirmation and can identify unknown contaminants by measuring exact mass, but it’s more expensive and typically used for verification or when HPLC results need additional validation. Most research-grade peptides rely on HPLC for purity reporting, with mass spectrometry as a secondary analytical tool when batch composition requires deeper investigation.
Lower-purity peptides contain residual solvents (like trifluoroacetic acid from synthesis), incomplete sequences, truncated peptide fragments, synthesis by-products, and degradation byproducts from the manufacturing process. These contaminants can interfere with experimental binding assays, cellular uptake studies, and bioactivity measurements. The specific impurity profile depends on the peptide synthesis method and purification steps used. A Certificate of Analysis details which contaminants are present in each batch, helping you assess whether they might affect your particular research application.
This article was written using GrandRanker