
Last Updated: August 19, 2026
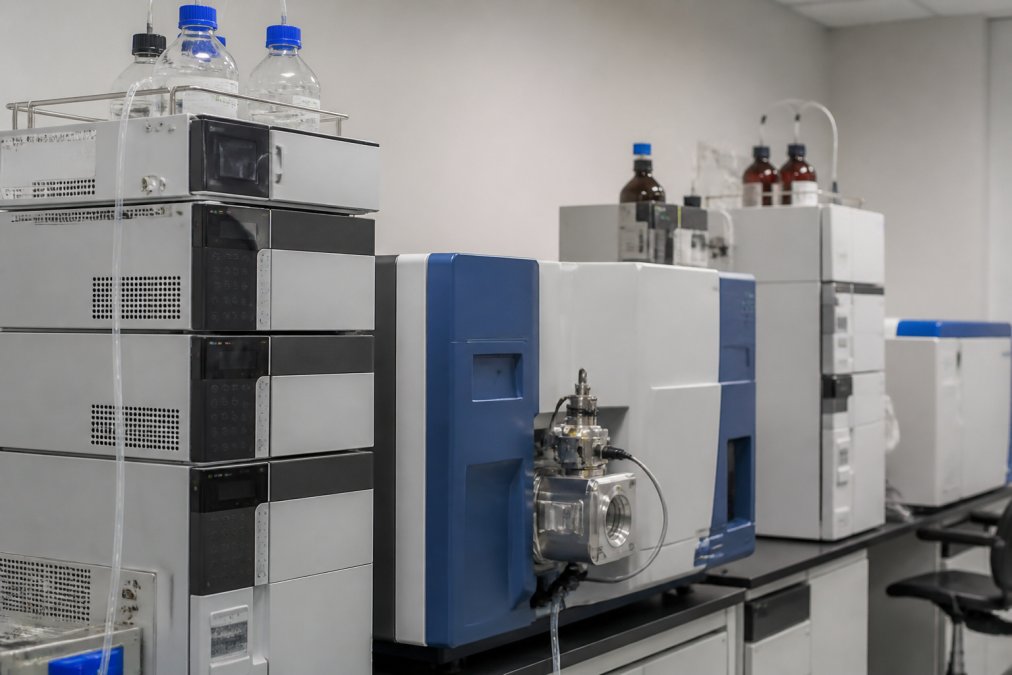
HPLC-MS peptide analysis combines high-performance liquid chromatography and mass spectrometry to separate, identify, and quantify peptides with high precision. It couples HPLC’s separation power with MS’s molecular identification capability, making it the gold standard for peptide characterization in research and clinical settings.
The two-stage process works like this: HPLC separates peptides by pushing them through a column filled with a stationary phase. Different peptides stick for different lengths of time, emerging at different points. Mass spectrometry then detects each peptide as it exits, measuring its mass-to-charge ratio and fragmentation pattern. Together, these techniques give you both the "when" (retention time) and the "what" (molecular identity).
At Rejuvenation Wellness Solutions LLC, we understand that researchers need to interpret HPLC-MS data, verify purity claims, and troubleshoot when results don’t match expectations. This guide walks you through the mechanics of HPLC-MS peptide analysis, how to read the output, and what to look for when evaluating your peptide source.
Reversed-phase HPLC (RP-HPLC) is the dominant method for peptide separation because peptides are amphipathic molecules with both hydrophobic and hydrophilic regions that interact predictably with the stationary phase.
In RP-HPLC, the stationary phase is nonpolar (typically octadecyl carbon chains bonded to silica), and the mobile phase starts polar and becomes increasingly nonpolar through gradient elution. Peptides bind based on hydrophobicity: more hydrophobic peptides stick longer; more hydrophilic peptides elute earlier. This separation is reproducible and can be fine-tuned by adjusting gradient slope, temperature, and mobile phase composition.
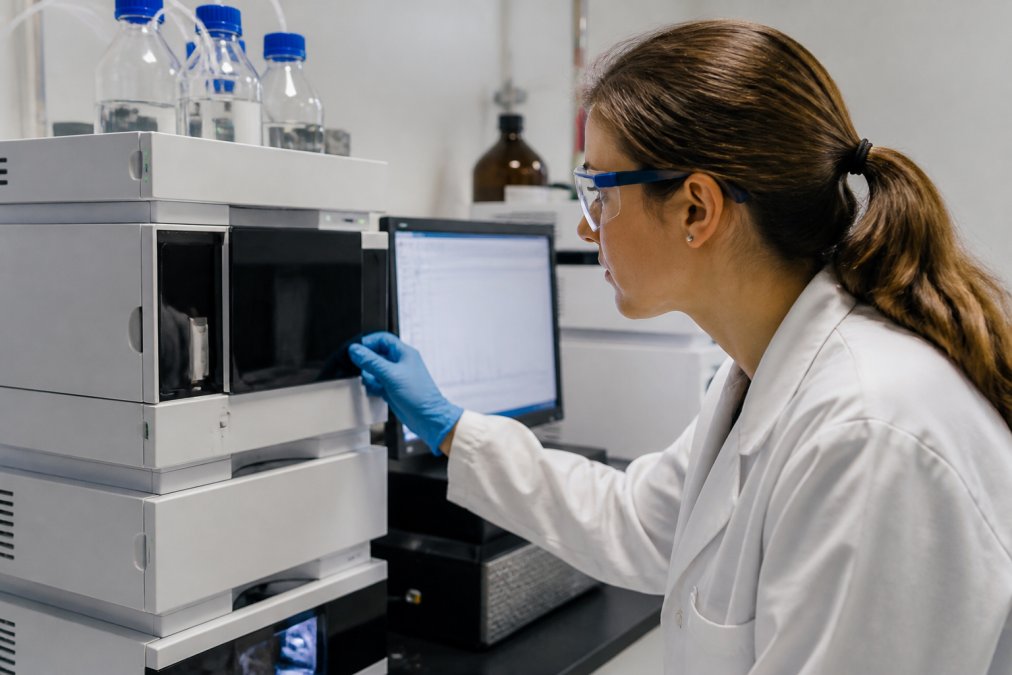
The mobile phase typically uses water and acetonitrile, often with ion-pairing agents like trifluoroacetic acid (TFA) or formic acid. These additives improve peak shape and resolution. Formic acid or acetic acid are preferred when coupling HPLC directly to mass spectrometry, since TFA can suppress ionization in the MS detector.
Gradient elution drives the separation. The instrument starts with high aqueous content and gradually increases acetonitrile percentage over time. A shallow gradient gives better separation but takes longer; a steep gradient is faster but may merge peaks. Column chemistry matters, most peptide work uses C18 columns, though C8 or C4 phases work for certain applications. Smaller particles give better resolution but require higher pressure and generate more heat, which can degrade sensitive peptides.
Temperature control is critical. Elevated column temperature (40-50°C) improves peak shape and reduces back-pressure, but can accelerate peptide degradation. Most labs run peptides at room temperature or slightly elevated temperatures as a compromise.
HPLC and LC-MS use the same separation technology but differ fundamentally in detection and information provided.
HPLC alone uses a UV detector, typically monitoring absorbance at 214 nm (peptide bond) or 280 nm (aromatic amino acids). This gives peak area, which correlates to peptide concentration. However, HPLC cannot determine molecular weight or identity. If your sample has impurities or related peptides with similar retention times, HPLC may not resolve them.
LC-MS couples HPLC separation with a mass spectrometer as the detector. As each peptide elutes, it’s ionized and measured for mass-to-charge ratio. This gives both retention time AND molecular weight. If two peptides have the same retention time but different masses, LC-MS will detect it.
For quantification, HPLC using UV detection is faster and simpler if you only need to know "how much peptide is in this sample" and you’re confident about its identity. LC-MS is more powerful but requires more expertise. When evaluating a peptide supplier’s purity claim, ask whether they used HPLC or LC-MS. HPLC-only purity data tells you peak area percentage but doesn’t confirm impurity identity. LC-MS purity data tells you the actual molecular weight of the major peak and significant impurities, which is far more informative. Rejuvenation Wellness Solutions LLC uses independent lab testing with a Certificate of Analysis for safety and purity.
A Certificate of Analysis (CoA) is your proof of what’s in the vial. It should include peptide identity, purity percentage, molecular weight, and the analytical methods used.
The CoA header should list the peptide name or sequence, lot number, and analysis date. The lot number is critical, it ties the data to your specific vial. Different lots of the same peptide can have different purity or potency, so always match the lot number on your vial to the CoA.
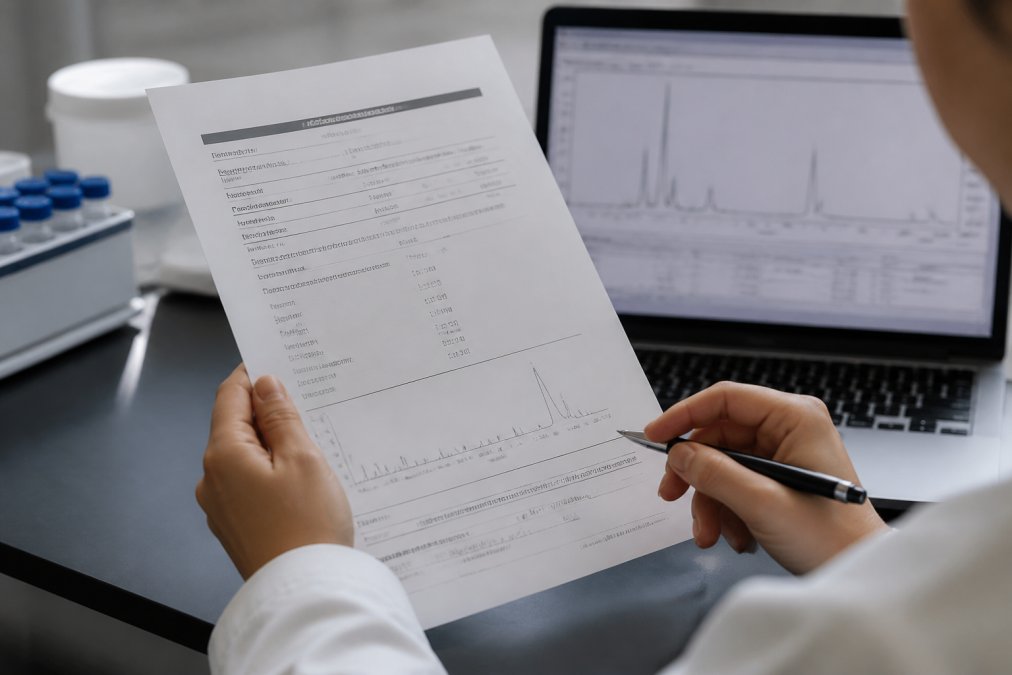
Purity percentage is usually stated as a percentage by HPLC or LC-MS. Look for the specific method used. "98% purity by HPLC at 214 nm" means the UV detector measured peptide absorbance and calculated that 98% of total peak area corresponds to your target peptide. "99% by LC-MS" is more reliable because the mass spectrometer has confirmed the molecular weight of the major peak.
Molecular weight should match the theoretical molecular weight of your peptide sequence. Discrepancies could indicate synthesis errors, post-translational modifications, or contamination. The CoA may list monoisotopic mass (lightest isotope of each atom) and average mass (weighted by natural isotope abundance). Most peptide work uses monoisotopic mass.
Water content (Karl Fischer titration) is often reported as a percentage. Peptides are hygroscopic and absorb moisture. A CoA listing 3-5% water is normal. Above 10% suggests improper storage or degradation.
The analytical method section should list HPLC or LC-MS conditions: column type, mobile phase, gradient, detection wavelength or MS parameters. Detailed method descriptions indicate the supplier is confident in their data and can reproduce it. Microbial testing (if present) shows whether the peptide was tested for bacterial or fungal contamination. For research peptides used in cell culture or animal studies, this is especially important.
A high purity percentage doesn’t guarantee quality. A 99% pure peptide can still be degraded or contaminated if the analysis method was weak. Always check the method. A 98% purity result from LC-MS with detailed fragmentation data is more trustworthy than a 99.5% result from HPLC with minimal documentation.
Before your peptide reaches the HPLC column, sample preparation can make or break your analysis. Poor preparation leads to irreproducible results, column fouling, and wasted troubleshooting time.
For solid peptides, dissolution is the first step. Most peptides are supplied as lyophilized powders. Acidic solvents (0.1% TFA in water, or formic acid) help keep peptides dissolved by protonating them and reducing aggregation. For hydrophobic peptides, you may need to add acetonitrile or other organic solvents. The goal is a clear, stable solution that doesn’t degrade over time.
Concentration matters. For analytical HPLC, aim for 0.1-1 mg/mL depending on the peptide and detector sensitivity. For LC-MS, you can often work at lower concentrations (1-100 µg/mL) because the mass spectrometer is extremely sensitive. Filtration before injection using a 0.2 µm syringe filter (PTFE or nylon) prevents column clogging, pump damage, and chromatogram artifacts.
Store prepared samples at 4°C for a few days or at -20°C for longer storage. Avoid repeated freeze-thaw cycles, which cause aggregation and degradation.
Method development involves optimizing the HPLC gradient to achieve good peak shape and resolution. Start with a shallow gradient (e.g., 5-50% acetonitrile over 30 minutes) and observe where your peptide elutes. If the peak is broad or tailing, adjust the pH of the mobile phase or column temperature. The goal is a symmetrical peak with a signal-to-noise ratio above 100:1 for quantification work.
When you order a research peptide, you’re trusting that the supplier has actually tested what they claim. Third-party testing is the verification layer that independent labs provide, separate from the manufacturer’s own quality control.
A manufacturer can claim 99% purity based on their own HPLC system. When an independent lab tests the same peptide using their own equipment and methods, you get an unbiased result. If the independent lab confirms 99% purity, you can trust it. If they report 94% purity, you know there’s a problem.
Rejuvenation Wellness Solutions LLC partners with WHO/GMP and ISO-certified manufacturers and 503B compounding pharmacies to ensure every product undergoes independent lab testing with a Certificate of Analysis for safety and purity. When you receive a peptide from Rejuvenation Wellness Solutions LLC, the CoA in the package is from an independent testing facility.
This matters because it protects your research. If your results don’t replicate, you know whether the peptide was the problem. A third-party CoA gives you that assurance. For clinical trials or regulatory submissions, third-party testing data carries more weight than manufacturer claims.
The independent lab should use validated methods, typically HPLC-UV or LC-MS, sometimes with additional techniques like mass spectrometry fragmentation analysis or amino acid analysis. When evaluating a peptide supplier, always ask for the independent lab CoA before purchasing. If they can’t provide one or only offer internal testing data, that’s a red flag.
Even with careful sample preparation and method development, problems happen. Learning to recognize and fix them separates experienced researchers from those who waste time guessing.
Peak tailing occurs when your peptide peak has a sharp front edge but a long, dragging tail. This usually indicates the peptide is interacting too strongly with the stationary phase or the mobile phase pH is wrong. Solutions: increase the pH of the mobile phase slightly, increase column temperature to reduce interactions, or switch to a different stationary phase. Tailing makes quantification unreliable because peak area calculation becomes ambiguous.
Peak splitting occurs when your single peptide appears as two or more peaks. This often means the peptide exists in different ionization states or conformations. If you’re using TFA in your mobile phase, try switching to formic acid or acetic acid. If that doesn’t help, the peptide may have aggregated or partially oxidized during storage. Prepare a fresh sample and test again.
Baseline noise or signal loss suggests either a sample problem or instrument issue. If noise is high but consistent, check your detector settings. If signal drops suddenly, the column may be fouled. Run a blank injection to see if noise persists. If it does, flush the column with strong solvent (high acetonitrile) to clean it.
Retention time drift between injections indicates the column is changing, usually because it’s accumulating residual material. Temperature fluctuations in the lab also cause retention time drift. Keep your HPLC system in a temperature-controlled room if possible.
Interpreting the chromatogram requires understanding what you’re looking at. The x-axis is time (retention time), and the y-axis is signal intensity (mAU for UV detection, counts for MS). Peak area is proportional to peptide amount. For quantification, use a standard curve by injecting known concentrations and plotting peak area versus concentration.
For purity assessment, the key metric is the percentage of total peak area corresponding to your target peptide. Mass spectrometry data interpretation requires recognizing the molecular ion peak (M+H for singly charged, M+2H for doubly charged, etc.). The molecular ion peak should match your theoretical molecular weight (within 0.01 Da for high-resolution MS). If you see unexpected fragment ions or if the molecular ion peak is missing, the peptide may be degraded or contaminated.
When troubleshooting, test one variable at a time. Change the gradient, re-inject, and observe. If that doesn’t fix it, revert and try something else. This systematic approach prevents multiple changes from obscuring which one actually solved the problem.
Understanding HPLC-MS peptide analysis helps you verify the quality of your research materials and troubleshoot when results don’t match expectations. The combination of chromatographic separation and mass spectrometry detection provides the specificity and sensitivity needed for rigorous peptide characterization. When you source peptides from a supplier that prioritizes third-party testing and transparent data, like Rejuvenation Wellness Solutions LLC, you gain confidence that your research foundation is solid. Shop with Rejuvenation Wellness Solutions LLC and access high-purity, independently tested peptides with same-day fulfillment and rapid shipping to support your research goals.
| Aspect | HPLC-UV Detection | LC-MS Detection |
|---|---|---|
| Separation Method | Reversed-phase chromatography | Reversed-phase chromatography |
| Detection | UV absorbance at 214/280 nm | Mass spectrometry ionization |
| Identity Confirmation | Retention time only | Molecular weight + fragmentation |
| Purity Determination | Peak area percentage | Peak area + mass verification |
| Selectivity | Moderate (co-eluting peaks merge) | High (mass-based filtering) |
| Quantification Speed | Fast | Moderate |
| Cost | Lower | Higher |
| Best For | Simple samples, high-throughput | Complex samples, identity-critical work |
HPLC separates peptides by molecular properties and measures absorbance at specific wavelengths, giving you purity and identity information. LC-MS combines separation with mass spectrometry detection, identifying peptides by their exact mass-to-charge ratio. LC-MS provides higher specificity and can detect impurities HPLC might miss, especially for complex peptide mixtures. Choose HPLC for routine purity checks; use LC-MS when you need definitive molecular weight confirmation or are analyzing highly complex samples.
Start with the peptide identity and molecular weight at the top. Check the purity percentage, third party tested research peptides should show 95% or higher. Review the HPLC chromatogram: one dominant peak indicates high purity. Look at the retention time and compare it to expected values. Verify the testing method used (HPLC, LC-MS, or both). Confirm the test date is recent and the lab is certified. The CoA should list any detected impurities and their concentrations. If anything is unclear, contact the supplier for clarification before use.
Mass spectrometry directly measures the molecular weight of peptides with extreme precision, confirming the exact amino acid sequence. HPLC alone shows separation but cannot definitively prove molecular identity, two different peptides might have similar retention times. MS detects fragmentation patterns unique to each peptide, catching impurities that HPLC might not resolve. For research requiring high confidence in peptide identity and purity, especially in clinical trials or regulatory submissions, MS is essential. It's the gold standard for synthetic peptide validation.
99% purity means that 99 out of 100 molecules in your peptide sample are the target peptide; the remaining 1% consists of impurities like truncated sequences, oxidized forms, or manufacturing residues. This is measured by HPLC peak area or LC-MS analysis. Higher purity reduces variability in your research results and minimizes off-target effects. For most research applications, 95% purity is acceptable; clinical trials and GMP-regulated work often require 98% or higher. Always verify purity claims with a Certificate of Analysis from independent lab testing.
This article was written using GrandRanker