
Last Updated: July 24, 2026
When you receive a Certificate of Analysis from an independent lab, you’re holding technical evidence that your peptides meet purity and identity specifications. Most researchers never learn what those numbers mean or how to spot inconsistencies that signal real problems.
This guide walks you through every section of an HPLC-MS peptide report, explaining what the data tells you about your sample and how to identify red flags. According to FDA guidance on analytical method validation, proper interpretation of chromatographic data is essential for ensuring product quality and research integrity.
High-performance liquid chromatography separates peptide mixtures based on their chemical properties as they move through a stationary phase under pressure. For peptides, reversed-phase HPLC is standard: the stationary phase is hydrophobic, while the mobile phase starts aqueous and gradually becomes more organic. Hydrophobic peptides bind longer; hydrophilic ones pass through quickly, creating distinct peaks for different molecular species.
A detector measures light absorption (usually at 214 nm, where peptide bonds absorb strongly) as each component exits the column. The instrument plots absorption intensity over time, creating a chromatogram. Peak area, not peak height, determines purity calculations.
The x-axis shows retention time (in minutes); the y-axis shows signal intensity (in millivolts or absorbance units). A large, clean peak means a concentrated, pure component. Multiple peaks indicate multiple components.
Retention time is reproducible for a given peptide under consistent conditions. If your target peptide elutes at 12.3 minutes today, it should elute near 12.3 minutes on your next batch (within ±0.2 minutes). Shifts beyond that suggest analytical drift or a real change in your sample.
Peak separation quality matters enormously. Two well-separated peaks are easier to integrate accurately than barely resolved peaks. Your lab should report the resolution factor (Rs) for critical peak pairs; a value above 1.5 indicates good separation.
Mass spectrometry measures the mass-to-charge ratio (m/z) of ionized peptide fragments. When your peptide is ionized, it may break into smaller pieces (daughter ions) that reveal the peptide’s structure. The mass spectrum shows peaks at specific m/z values, creating a molecular fingerprint.
The most important peak is the molecular ion (M+H)+, which represents your intact peptide plus one proton. If your peptide has a theoretical molecular weight of 1,234 Da, you should see a peak at m/z 1,235 (the +1 charge state). Larger peptides often appear as doubly or triply charged ions. Your lab should report which charge state was observed and whether it matches predictions.
Comparing your observed molecular weight to the theoretical value is the primary identity test. A match within ±0.1% (or ±1 Da for smaller peptides) confirms you have the right structure. Deviations suggest oxidation (adds 16 Da per oxidized methionine), phosphorylation (adds 80 Da), or contamination.
Ion-exchange chromatography, sometimes used alongside reversed-phase, provides an orthogonal separation method. If your peptide appears in the same relative position on both columns, confidence in identity increases significantly.
The intensity of the molecular ion peak tells you how readily your peptide ionizes. Low molecular ion intensity doesn’t necessarily mean low purity; it might indicate poor ionization. However, many unexpected peaks at other m/z values suggest degradation products or contaminants.
Tandem MS (MS/MS) fragments the molecular ion intentionally and measures resulting daughter ions. The fragmentation pattern is highly specific to your peptide sequence. A match to theoretical predictions strongly confirms identity.
Purity percentage is the proportion of your sample that is the target peptide, calculated from the HPLC chromatogram. If your main peak has an area of 9,500 units and total area is 10,000 units, your purity is 95%. The remaining 5% includes water, salts, degradation products, and synthesis byproducts.
This differs from content (or assay), which accounts for water and salt. A sample might be 95% pure peptide by HPLC but only 80% content by mass if it contains 15% water and salt. Your Certificate of Analysis should report both. Rejuvenation Wellness Solutions LLC and reputable suppliers ensure products are 99%+ pure by HPLC and clearly report water content separately.
A 99% purity claim means 99 out of every 100 molecular units are the target peptide. For most research applications, 95-99% purity is acceptable. Below 95%, impurities risk confounding results. The nature of impurities matters as much as the percentage: contamination with a structurally similar peptide is more problematic than contamination with inert salt.
Integration measures the area under each peak. Modern HPLC software does this automatically, but algorithms can fail when peaks overlap or baseline noise is high. Manual review is essential.
Your lab should use consistent integration parameters across all batches. Ask for their standard operating procedures (SOPs) for integration; professional labs have written, documented methods. The integration report should show baseline points, peak boundaries, and calculated areas.
LC-MS combines liquid chromatography separation with mass spectrometry detection. Each peak in the chromatogram has an associated mass spectrum, showing what m/z values were detected at that retention time. This adds specificity: you can confirm that the peak at 12.3 minutes is your target peptide because its mass spectrum matches expectations.
However, ionization efficiency may vary with mobile phase pH and organic solvent concentration. A large UV peak might have weak mass signal if ionization is poor at that point in the gradient.
Retention time shifts occur naturally as columns age. The stationary phase gradually loses its hydrophobic coating, causing peptides to elute earlier. Most labs account for this by running control standards alongside your samples.
Gradient elution, the programmed increase in organic solvent over time, drives peptides off the column. A shallow gradient gives sharper peaks and better separation; a steep gradient is faster but less precise. If your lab changes the gradient, retention times will shift, but relative retention times should remain similar.
Unknown peaks are common. First, check the mass spectrum. If the unknown peak has an m/z value that doesn’t match any expected peptide or known impurity, it’s likely a salt or solvent artifact. If it matches your target within 1-2 Da, suspect oxidation, phosphorylation, or modification.
Degradation products are common for peptides in solution. Peptide bonds can hydrolyze, creating shorter fragments. Methionine can oxidize (adds 16 Da). Asparagine and glutamine can deamidate (adds 1 Da). Multiple peaks clustered around your main peak, each differing by 1 or 16 Da, suggest these modifications.
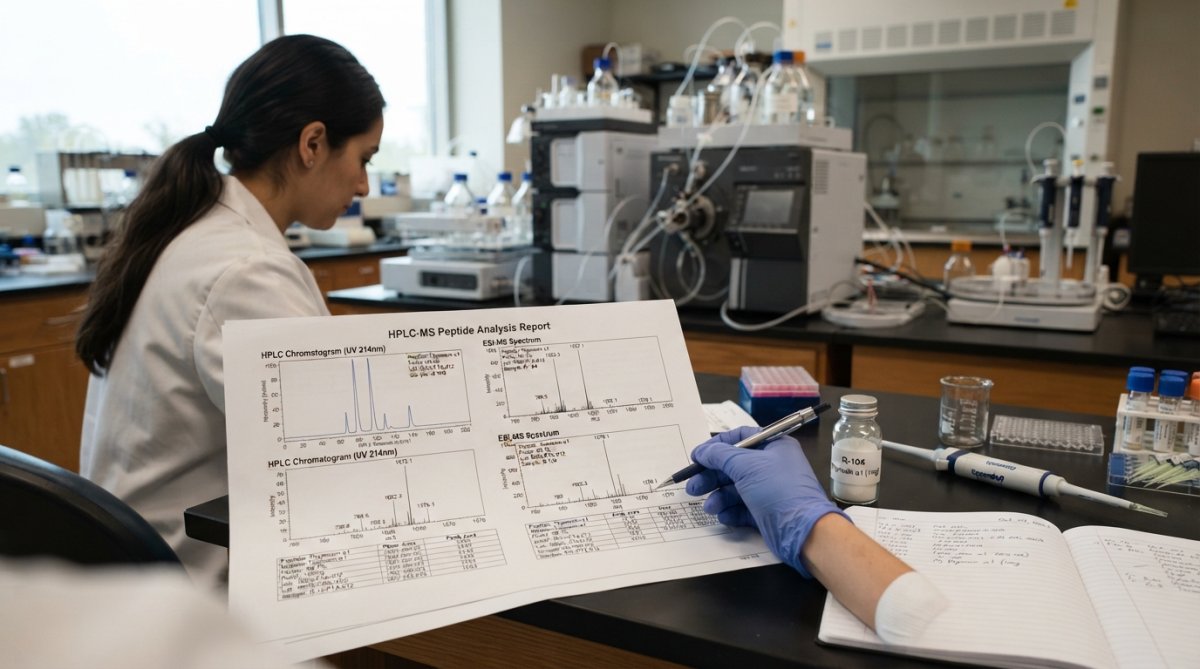
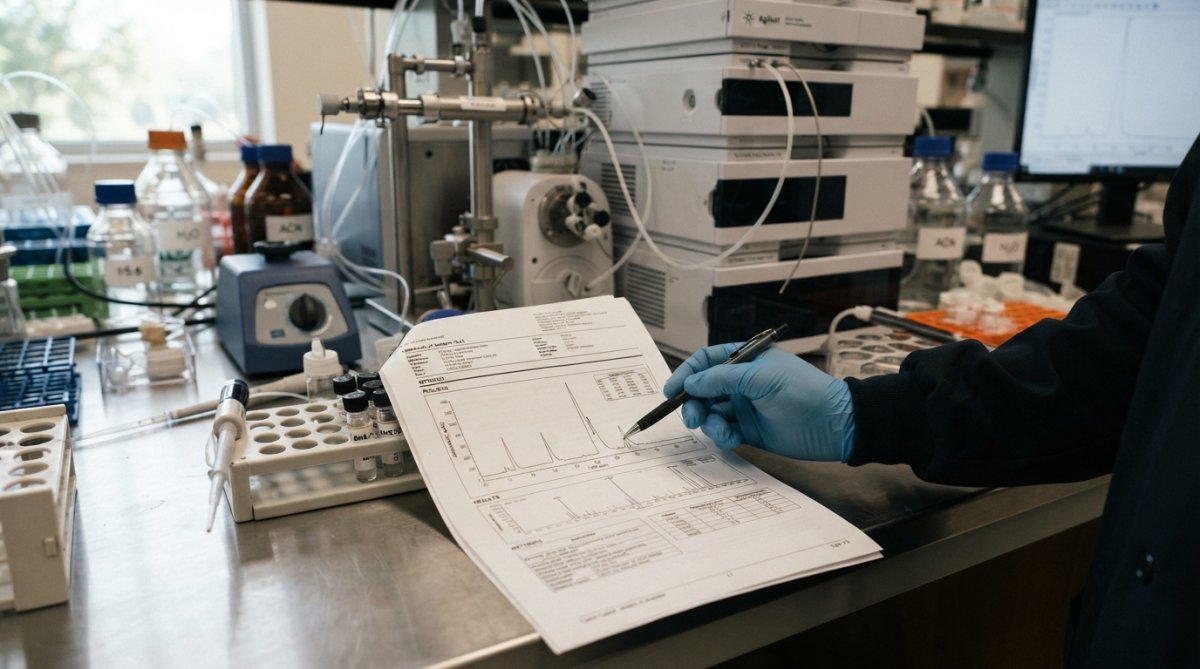
A Certificate of Analysis from a reputable lab includes sample identification, method description, chromatogram image, integration results, mass spectrum, and conclusions.
The sample ID should match your order exactly: peptide name, sequence, lot number, and analysis date. The method section describes the HPLC column, mobile phase composition, flow rate, temperature, and detection wavelength. This information is essential for understanding whether the analysis was appropriate for your peptide.
Start by examining the overall shape. A clean, single large peak with minimal baseline and noise suggests high purity and good technique. Multiple large peaks suggest lower purity or a mixture.
Zoom in on the main peak. Is it symmetrical or tailed? Symmetrical peaks are easier to integrate accurately. Check the baseline between peaks: it should be flat and close to zero. High baseline noise makes small peaks hard to detect.
Look at integration marks (vertical lines at peak boundaries). Do they seem correctly placed, or do they cut off parts of the peak or include noise? Your lab should review this manually.
Signal-to-noise ratio (S/N) compares peak height to baseline noise. A main peak with S/N of 1,000:1 is excellent. S/N below 100:1 for small peaks raises concerns about detectability.
Your lab should report system suitability tests (SST), control runs performed before your sample to verify the instrument is working correctly. The CoA should reference SST results: column efficiency, peak symmetry, and resolution values. If SST failed, your lab should not have analyzed your sample.
Traceability is essential. Your CoA should reference the specific instrument used, the analyst’s initials or ID, the date and time of analysis, and any deviations from standard procedures.
Not all labs are equal. Some cut corners on analytical validation, misreport data, or use outdated methods.
The most obvious red flag is a CoA with no chromatogram image. A legitimate lab always provides the raw chromatogram so you can see the data yourself. Another red flag is inconsistent purity reporting: if one batch looks visually similar to a previous batch but reports different purity, suspect inconsistent integration methods.
Missing data is telling. A CoA should include retention time, peak area, molecular weight confirmation, and ideally a mass spectrum. Professional labs like those partnered with Rejuvenation Wellness Solutions LLC provide comprehensive data.
Batch consistency means successive batches of the same peptide should show similar purity, retention time, and impurity profiles. If batch 1 is 99% pure with a main peak at 12.3 minutes, batch 2 should be similar (within ±1% purity, ±0.2 minutes retention time).
Large swings in purity between batches suggest either real quality control problems or inconsistent analytical methods. Neither is acceptable.
Traceability means you can track your sample from order through synthesis, testing, and delivery. Your CoA should include lot numbers, synthesis dates, and testing dates. Request the raw data files (chromatogram and mass spectrum files in standard formats) from your lab. Reputable suppliers provide these.
Ask your lab for their SOPs for HPLC analysis, MS calibration, and data integration. These should be written, version-controlled documents. Analytical validation includes specificity, accuracy, precision, and linearity. Your lab should have validation data on file.
WHO/GMP and ISO certification are meaningful indicators. These certifications require documented procedures, regular audits, and quality control measures. Rejuvenation Wellness Solutions LLC partners with WHO/GMP and ISO-certified manufacturers to ensure this level of rigor.
Quality control (QC) in peptide manufacturing means running the same tests on every batch and comparing results to specification limits. Specification limits are ranges you define based on your needs: purity between 95-99%, water content below 5%, endotoxin below 10 EU/mg.
Batch consistency is achieved by standardizing synthesis conditions, purification methods, and analytical procedures. Your lab should maintain a batch history, a record of all batches of your peptide with purity, retention time, and any issues noted.
When you receive a new batch, compare it to the previous one. Start with obvious metrics: purity (within ±1-2%), molecular weight (exact match), and retention time (within ±0.2 minutes). If all three match, confidence is high that you have a consistent product.
Next, examine the impurity profile. Are the same minor peaks present in similar proportions? New peaks suggest either a change in synthesis conditions or contamination.
Check water content and assay. These should be consistent too. If one batch is 99% pure but 85% content due to high water, and the next is 99% pure but 95% content, the actual amount of peptide per milligram differs significantly.
If you’re using peptides in clinical research, in vivo studies, or therapeutic development, stricter validation requirements apply. FDA guidance on peptide drugs requires not just purity, but also characterization of impurities, stability data, and manufacturing process validation.
For clinical applications, your lab should provide identity confirmation by at least two orthogonal methods (e.g., HPLC + MS + amino acid analysis), purity by HPLC with identified impurities, water content by Karl Fischer titration, endotoxin testing, sterility testing, and stability data.
A practical approach: establish a baseline CoA for your first batch. Define what "normal" looks like for purity, retention time, and impurity profile. For all subsequent batches, compare to that baseline. If a batch deviates significantly, ask your lab to investigate before you use it.
| Metric | Acceptable Range | Red Flag |
|---|---|---|
| Purity | Within ±2% of previous batch | Shift >2% or <95% absolute |
| Retention time | Within ±0.2 minutes | Shift >0.3 minutes |
| Molecular weight | Exact match (±1 Da for <2 kDa) | Deviation >1 Da |
| Water content | <5% (typical) | >10% or unexplained change |
| Unknown peaks | Absent or <1% area | New peaks >1% or growing |
| S/N for main peak | >100:1 | <50:1 (suggests poor data quality) |
Interpreting your HPLC-MS peptide reports is a learned skill, but the fundamentals are straightforward: purity tells you what fraction of your sample is target peptide, mass spectrometry confirms identity, and consistency across batches tells you whether your supplier is reliable. When you receive your next Certificate of Analysis, use this guide to verify that the data supports the claims. Ask your lab questions if anything seems unclear; a professional lab welcomes scrutiny. Rejuvenation Wellness Solutions LLC emphasizes this level of transparency, providing comprehensive Certificates of Analysis and supporting customers with same-day fulfillment and responsive customer service so you can focus on your research with confidence in your peptide quality.
HPLC purity measures the percentage of your target peptide relative to all detectable compounds in the sample, calculated through peak integration on the chromatogram. Content refers to the actual mass or concentration of peptide present. A report showing 99% purity means 99% of detected signals belong to your peptide; the remaining 1% represents contaminants or degradation products. Understanding this distinction is crucial when reviewing HPLC-MS peptide reports, as high purity doesn't always guarantee sufficient absolute quantity for your research.
An HPLC chromatogram plots signal intensity (y-axis) against retention time (x-axis). Your target peptide appears as a peak at a specific retention time determined by its interaction with the stationary phase during reversed-phase or ion-exchange separation. The peak's height and area indicate abundance; larger peaks suggest higher peptide concentration. Signal-to-noise ratio matters, a clean peak with minimal baseline noise indicates better purity. Multiple peaks suggest impurities or degradation products. Examine the full gradient elution profile to identify all compounds present in your sample.
Mass spectrometry provides molecular weight confirmation and identifies compounds by their mass-to-charge ratio, offering a second validation layer beyond retention time. While HPLC separates peptides based on physical properties, MS definitively identifies molecular structure. When combined as LC-MS, you get both separation (HPLC) and structural confirmation (MS). This dual validation prevents false positives from impurities with similar retention times but different molecular weights. For biopharmaceutical validation and quality assurance, LC-MS data interpretation challenges are minimized because two independent analytical methods confirm peptide identity.
Watch for inconsistent batch consistency across multiple reports, purity should remain stable within expected ranges. Suspicious signs include missing standard operating procedure details, vague analytical validation descriptions, or absent traceability information linking reports to specific batch numbers. Reports lacking signal-to-noise ratio documentation or showing unusually perfect peak shapes may indicate data manipulation. Verify that your supplier's partner manufacturers hold WHO/GMP and ISO certifications and that independent labs performed testing. If reports lack chromatogram images or mass spectra details, request them before purchase. Rejuvenation Wellness Solutions provides full Certificate of Analysis transparency with every order.
Retention time shifts occur when mobile phase composition, column temperature, or stationary phase conditions change between runs. Minor shifts (±2-3%) are normal and don't indicate problems. However, significant shifts (>5%) suggest possible column degradation, pH drift, or temperature inconsistencies. When comparing reports across batches, retention time consistency indicates stable analytical conditions and reliable quantification. If your peptide's retention time shifts dramatically, investigate gradient elution parameters and column maintenance history. Always compare new reports against baseline standards established during initial validation to distinguish normal variation from genuine analytical problems.
Yes. Legitimate reports should clearly identify the testing laboratory name, certification numbers (ISO 17025 accreditation for analytical labs), and contact information. Request the lab's independent status and ask whether your supplier owns the facility or uses third-party testing. WHO/GMP and 503B compounding pharmacy partnerships provide additional credibility. Cross-reference lab certifications on regulatory databases. Rejuvenation Wellness Solutions partners with WHO/GMP and ISO-certified manufacturers and independent testing facilities, with full traceability documented in every Certificate of Analysis. Always request raw chromatogram and mass spectra data, not just summary purity percentages, to verify analytical rigor.
A complete Certificate of Analysis should include: peptide identity (confirmed by molecular weight and MS data), purity percentage with peak integration details, retention time and gradient elution parameters, mobile phase and stationary phase specifications, signal-to-noise ratio documentation, batch number with traceability, testing date and expiration projections, and the testing laboratory's credentials. It should show the full chromatogram and relevant mass spectra, not just numerical summaries. Look for standard operating procedure references and analytical validation details confirming the method's reliability. Biopharmaceutical-grade reports include additional contaminant and degradation product identification, ensuring comprehensive quality control documentation.
This article was written using GrandRanker